Explanation of ABPM
plots
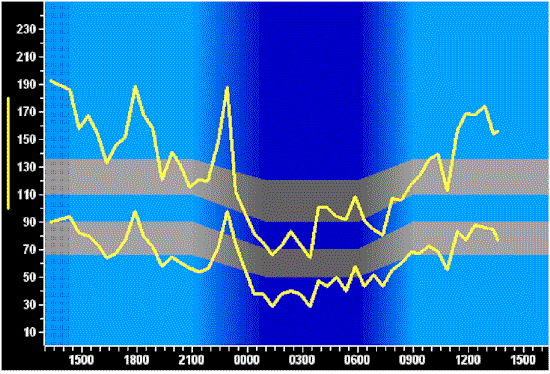
ABPM plot showing increased blood pressure variability in an elderly
patient.
Back to Elderly People
[Home] [Introduction]
[Procedure] [Obtaining
a blood pressure profile] [Equipment]
[Blood pressure measurement in special circumstances]
[Conclusions] [Credits]
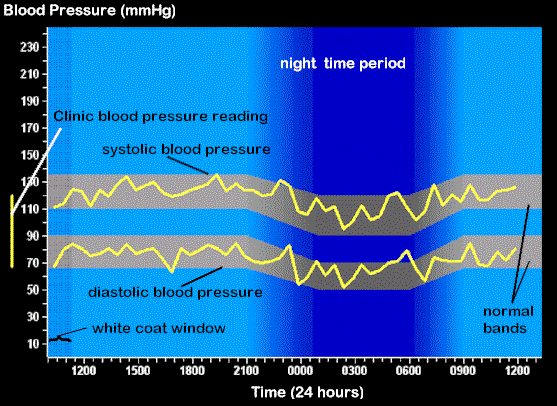
Each of the ABPM profiles in this package is laid out as follows:
- X axis: time (24 h)
- Y axis: blood pressure (mm Hg)
- The yellow line adjacent to the Y axis represents the clinic blood pressure obtained for
that patient.
- The horizontal grey bars represent the accepted normal limits for systolic and diastolic
blood pressure obtained by ABPM, including the nocturnal dip.
- The vertical bars on the left of the profile represent the "white coat"
window, when the effect of medical staff on blood pressure may still be evident.
- The darker vertical band of shading represents night time.
Back to top
© BHS 1999